+++++++++++++++++++++++++++++++++++++++++++++++++++
Please note:
This article applies to SmartBar in MS CRM 2013, 2015, as well as to MS CRM 2015/2016.
+++++++++++++++++++++++++++++++++++++++++++++++++++
Basically, there are two possibilities to enable debugging:
Solution 1) Activating debugging by using the SmartBar Settings (recommended way, only if the SmartBar Settings doesn’t work, use the second solution).
Solution 2) Activating debugging manually via MSCRM-ADDONS.com Settingskeys
Solution 1) How to activate debugging by using the SmartBar Configuration, step-by-step description
Open the Settings of SmartBar for MS CRM 2013. Please note, that only the users owning at least one of the selected SecurityRoles listed in the SmartBar Config, are able to see the Settings-Icon. Please find the button that opens the settings in the SmartBar ribbon.
Figure 1: Settings of the SmartBar Dialog highlighted in green
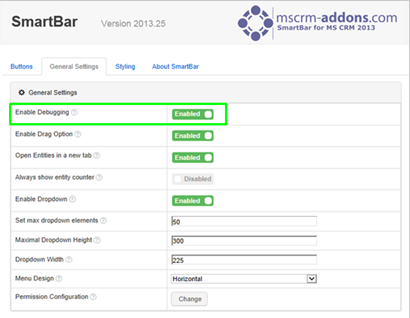
This action will open the SmartBar Settings. There, select the General Settings-tab and enable debugging.
Figure 2: Enable debugging in the SmartBar Settings
If debugging is enabled, hit the [Save]-button. Now debugging is activated. Please scroll down and read detailed information on how to access the log files.
Solution 2) HOW TO: activate debugging manually via the MSCRM-ADDONS.com Settingskeys step-by-step description
In CRM navigate to Settings.
Figure 3: Settings in CRM
In the settings, select MSCRM-ADDONS.com Products in the Extension area.
Figure 4: the MSCRM-ADDONS.com Products in the Extension area.
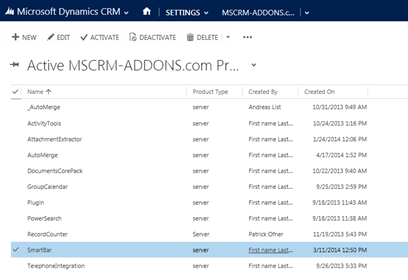
This action will open a list with all active MSCRM-ADDONS.com Products.
Figure 5: Active MSCRM-ADDONS.com Products in CRM.
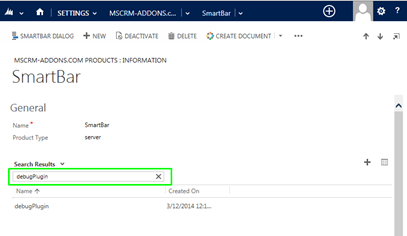
Next, select SmartBar with a double-click on it. In the next window search for debugPlugin.
Figure 6: SmartBar debugPlugin
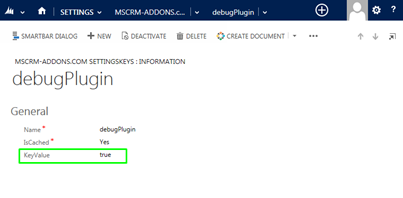
If a result is found, double click on it and set the KeyValue on true.
Figure 7: SmartBar debugPlugin – general information.
If no setting with this name is found, you have to create a new Settingskey. To do this, please click on the drop-down-button next to SmartBar in the CRM ribbon and select MSCRM-ADDONS.COM Settingskey.
Figure 8: Settingskey in the CRM ribbon
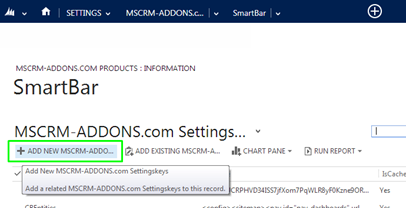
In the following window, click on the [+ADD NEW MSCRM-ADDONS.com Settingskey]-button.
Figure 9: Add a new Settingskey to CRM
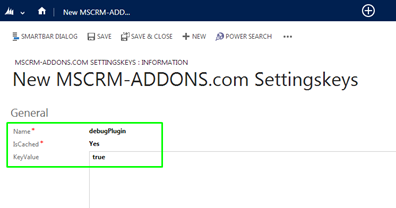
Now create a new Settingskey with the following value and save your settings.
Figure 10: New MSCRM-ADDONS.com Settingskey
SOLUTION 2) How to acces the log files, step-by-step description
The log files will be stored in the MSCRM-ADDONS.com Debug-entity. The easiest way to access it, is by using the Advanced Find.
Figure 11: Advanced Find in CRM
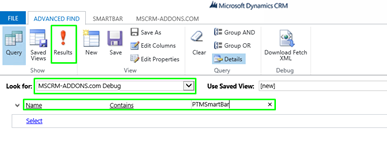
This action will open the Advanced Find. There select the MSCRM-ADDONS.com Debug-entity and include the following condition Name must Contain PTMSmartBar. This ensures that only SmartBar log files will be retrieved. Then hit the [Results]-button.
Figure 11: Advanced Find window in CRM.
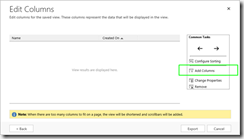
The editor displayed in Figure 12 opens.
Figure 12: Edit Columns functionality
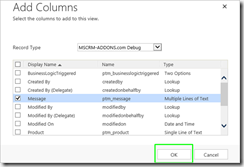
Use the Add Columns-functionality and add the ptm_message-field to the grid. Press the [OK]-button in order to continue.
Figure 13: Add columns
Back to the main dialog, click on the [Results]-button.
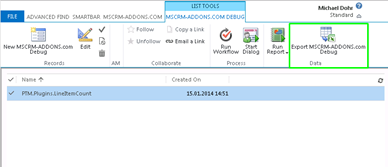
Next, delete all retrieved debug records. Another way is to select the debug file by the Created On-date. Then reproduce the error and refresh the result list of this Advanced Find. This ensures that you only have the latest and relavant log files. Select all records and hit the [Export MSCRM-ADDONS.com Debug]-button.
Figure 14: [Export MSCRM-ADDONS.com]-button in CRM Advanced Find
In the next dialog check “Static worksheet …” and hit the [Export]-button.
Please send the excel log-file with a short error description and a screenshot to support@mscrm-addons.com
![image[19] image[19]](https://cdn.mscrm-addons.com/wp-content/uploads/2014/5/duplicate1_image[19]_thumb.png)

