As Dynamics 365 has charts functionality out of the box we allow you to easily import them into your templates.
This feature is available for Dynamics 365, Client 10.7; Server version 2020.32.
Before you can import a Dynamics 365 Chart from Dynamics 365 in your document you must choose a template from your template selection. This feature can only be used within DCP templates, so please open your existing template, or create a new one before using this feature.
1. Import a chart
Now you have a look at the chosen document. To go further with the import, press the [Import Chart]-button on the top of the document.
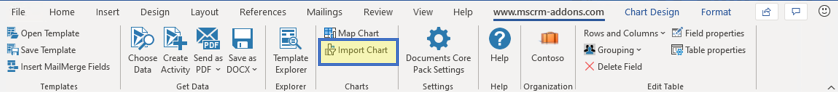
Figure 1: Import Chart-button
The LookUp Record dialog opens.
Select the chart you want to import. In this case, it is the pie chart from the dashboard named “Opportunity by Status”. Press “OK”.
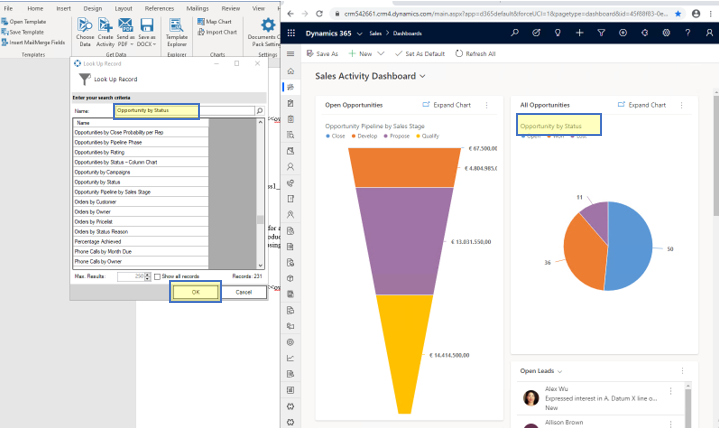
Figure 2: Chart selection
A list of support chart types can be found in the main article of this feature here.
Please Note: Imported Charts do not have a record related filter. Like in this example you would see a chart of all quotes. To limit the results of to the base entity of your template you can set a “qid”-Filter, along with other filters (e.g. only this year). This is described further down in the “edit your relations ship” part.
A placeholder for the selected chart “Opportunity by Status” is placed into your template as the example below shows.
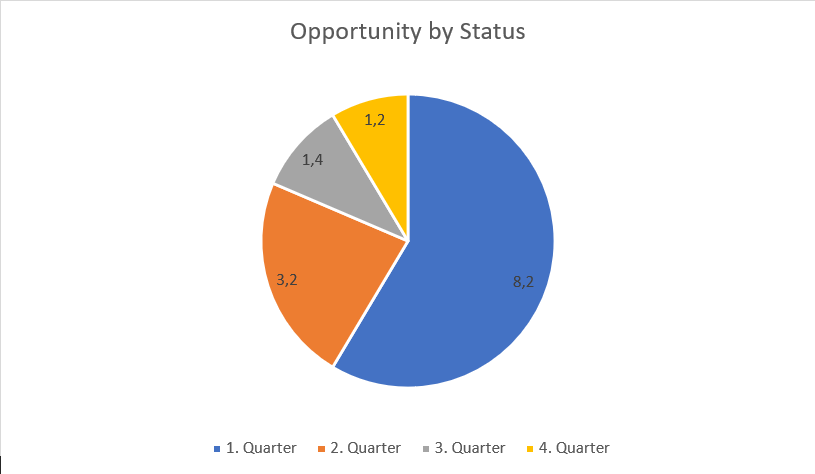
Figure 3: Imported Chart
Please Note: As Word charts and Dynamics charts are two separate systems you most likely see differences, but we try to apply the style as good as possible. You can make adjustments
If you import a Chart it basically consists of two parts. The visual component which was we try to convert the Dynamics 365 Chart as far as possible in a very likely Word version of it. The second component is the actual query that gets the data from your system. This query is added as an additional relationship to the template. You can modify both parts after you inserted the chart into your document.
2. Edit the chart by using “Field Properties” (optional)
To apply a specific formatting to values you can configure this by using the field properties ❶ option in our ribbon.
You can add/remove series and category entries ❷ or edit existing once by double-clicking on the elements ❸.
Other visual changes can be performed with the standard word formatting options of charts.
More details about the formatting options can be found here.
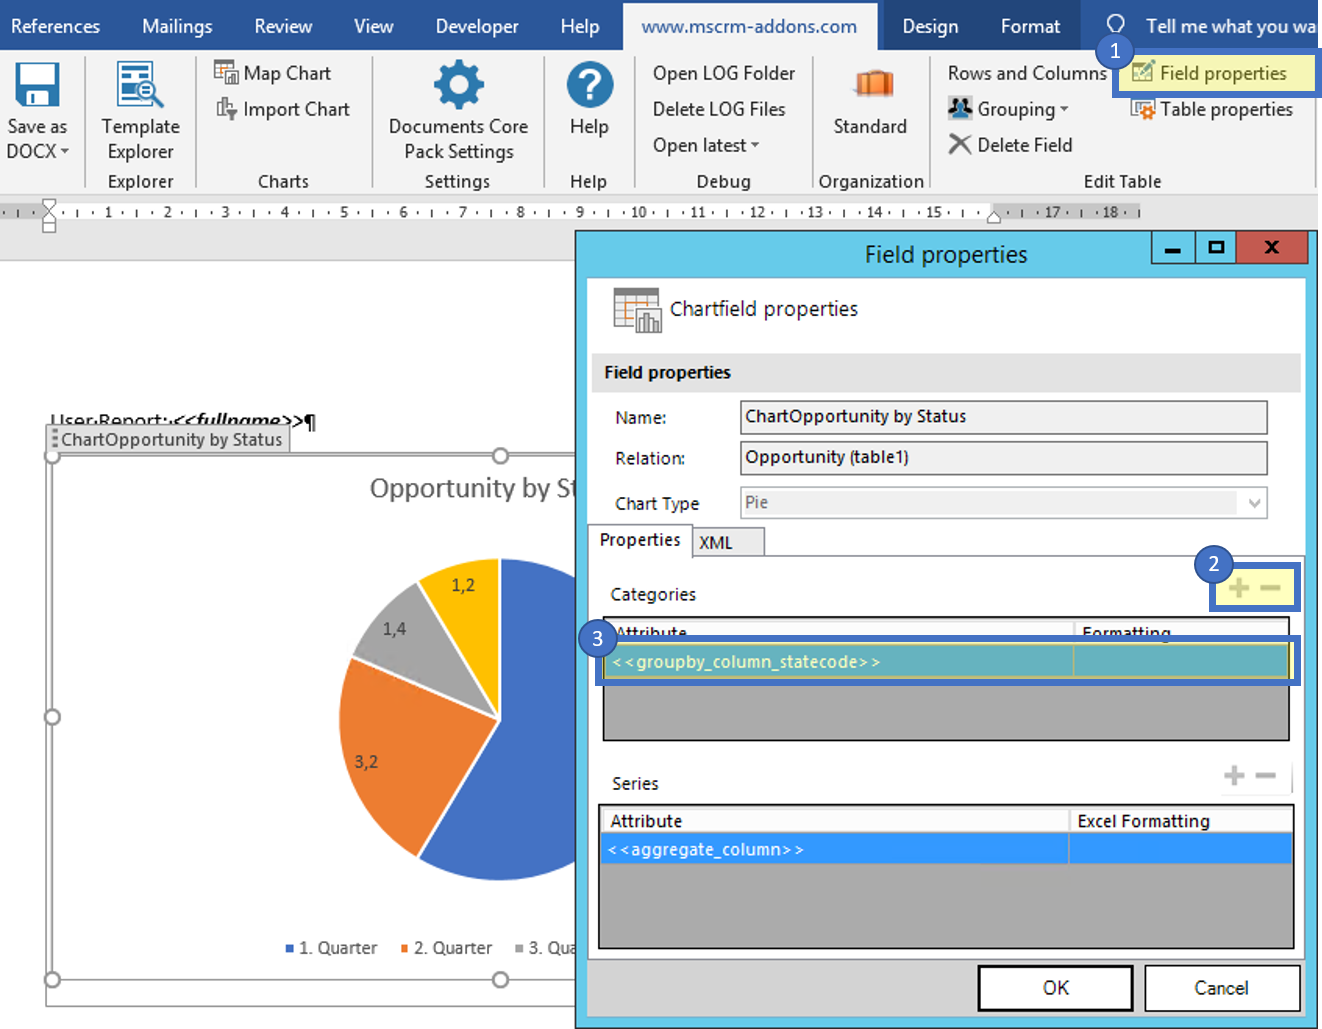
Figure 4: Field Properties of a chart
3. Edit the imported relations ship (optional)
After the import, you can see an additional relationship in the template designer. With the [Edit]-button the “Configure Fields and Datasource”-window pops up where you are able to configure the data source. Most likely you want to add specific filters as the Dynamics 365 charts to not have any record specific filter.
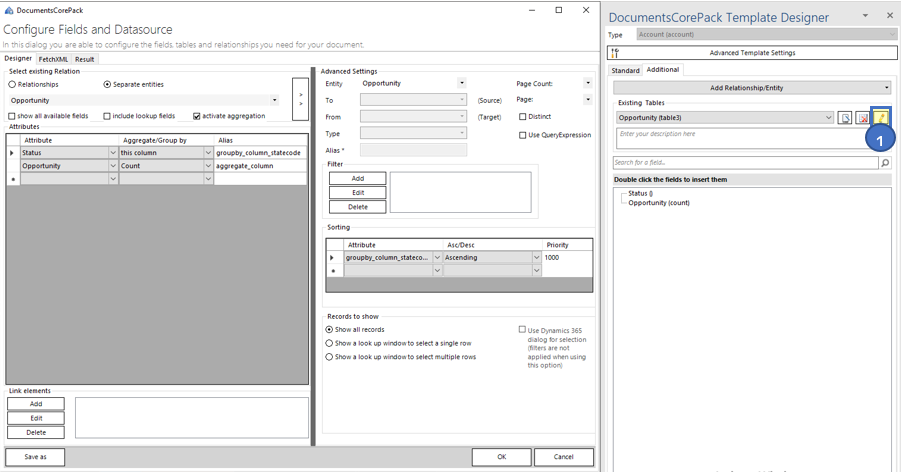
Figure 5: Configure Fields and Datasource
To filter on the ID of the specific record you have set up a so called “qid”-Filter.

Figure 6: qid-filter sample
PLEASE NOTE: If you are adding the “qid”-Filter always ensure that you are using the “in” operator!
If you compare the imported chart with the actual chart on your MS CRM Dashboard you might notice that there are differences, but not in the values it is representing rather than in the color or style. The document is ready to send.
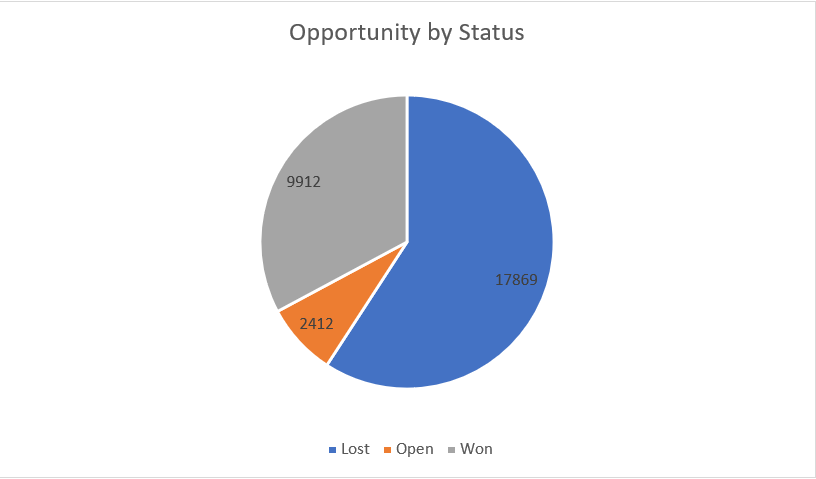
Figure 6: Document with imported chart
4. Save your template
Before you can use or test your template you have to save it.
Either you save your template locally with the standard Save or Save as
the functionality of Word or you use the Save template-option of the
DocumentsCorePack client in order to publish the template to Dynamics 365.
5. Test your template [optional]
As you have made changes to your template you might want to test them quickly.
A step by step description of how to test your template can be found here.
That´s it! We appreciate your feedback! Please share your thoughts by sending an email to office@mscrm-addons.com